Skip to content
Suite Hub

One system. Multiple layers of market clarity.

BlackChart is built as an integrated trading suite around four indicators. Together, they help traders read market context, decode structure, measure movement quality, and locate liquidity sweeps and the zones still in play.
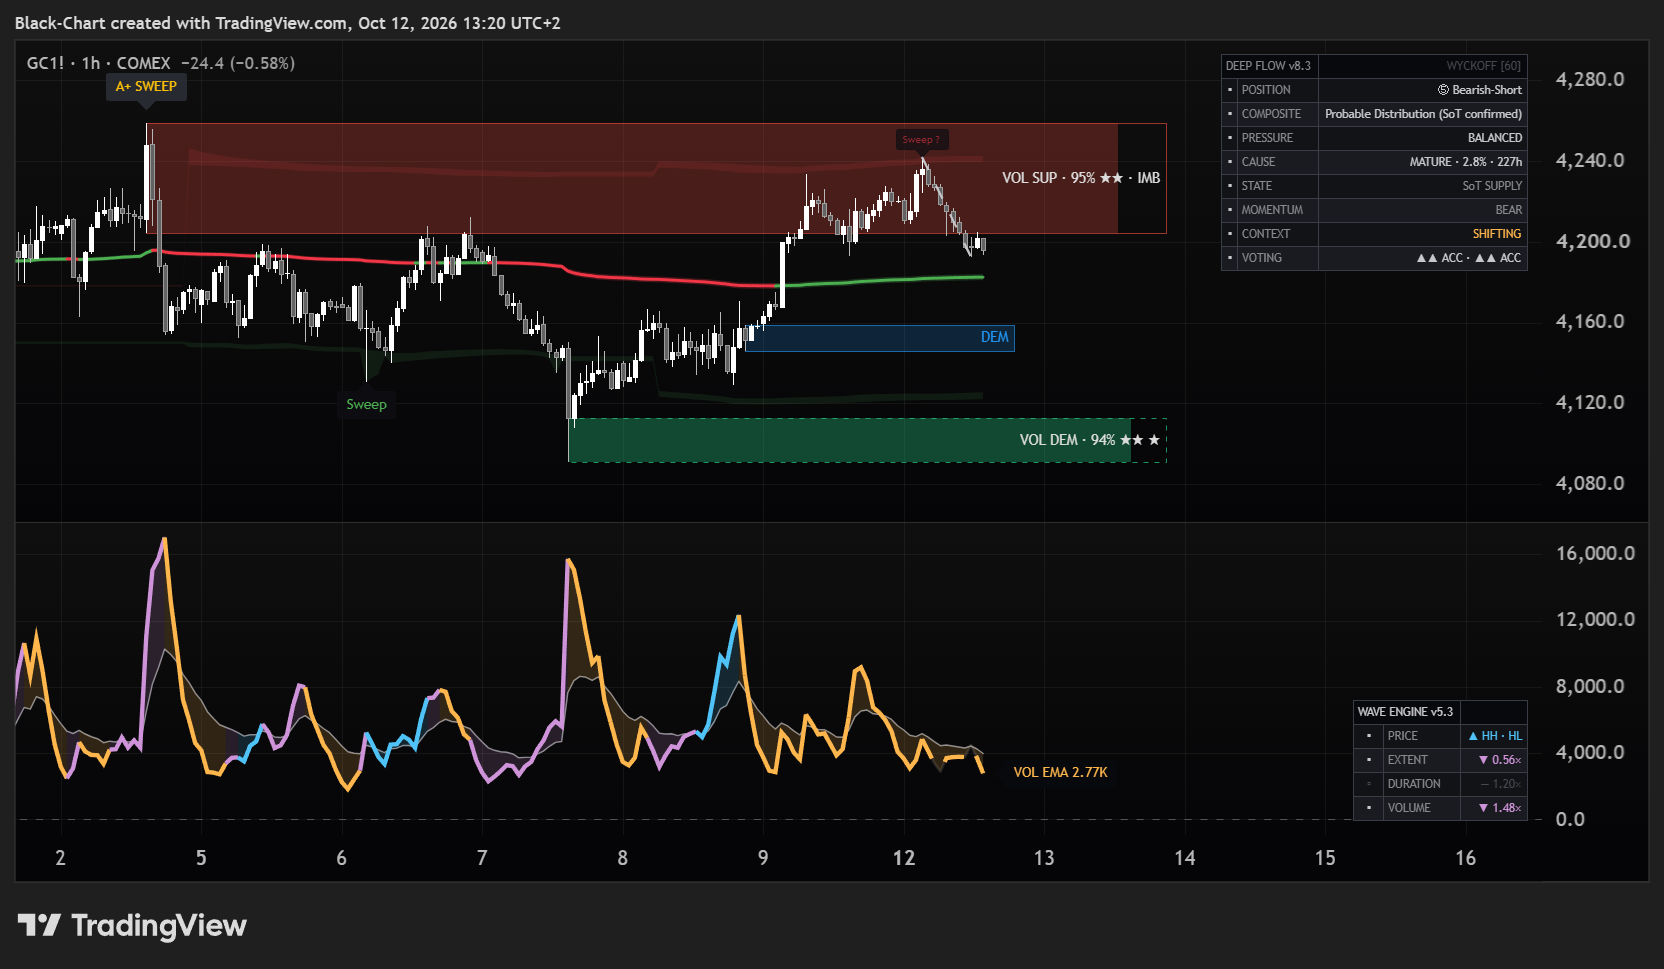
Gold futures one-hour chart with the BlackChart Suite: Deep Flow dashboard and anchored VWAP, Smart Money Radar supply and demand zones, and the Wave Engine volume pane below.
Deep Flow reads the macro context
Structural Decoder defines market structure
Wave Engine compares each wave with the one before
Smart Money Radar maps sweeps, imbalances and key zones
System overview

The Composite Blueprint

BlackChart is not a collection of separate indicators. It is a connected 4-pillar system covering macro context, market structure, measured wave data, and liquidity-based execution context.

Deep Flow

The context engine of the suite

Deep Flow helps traders read macro market context through detailed volume data, Wyckoff state, and accumulation, distribution, or balance conditions.

explore indicator
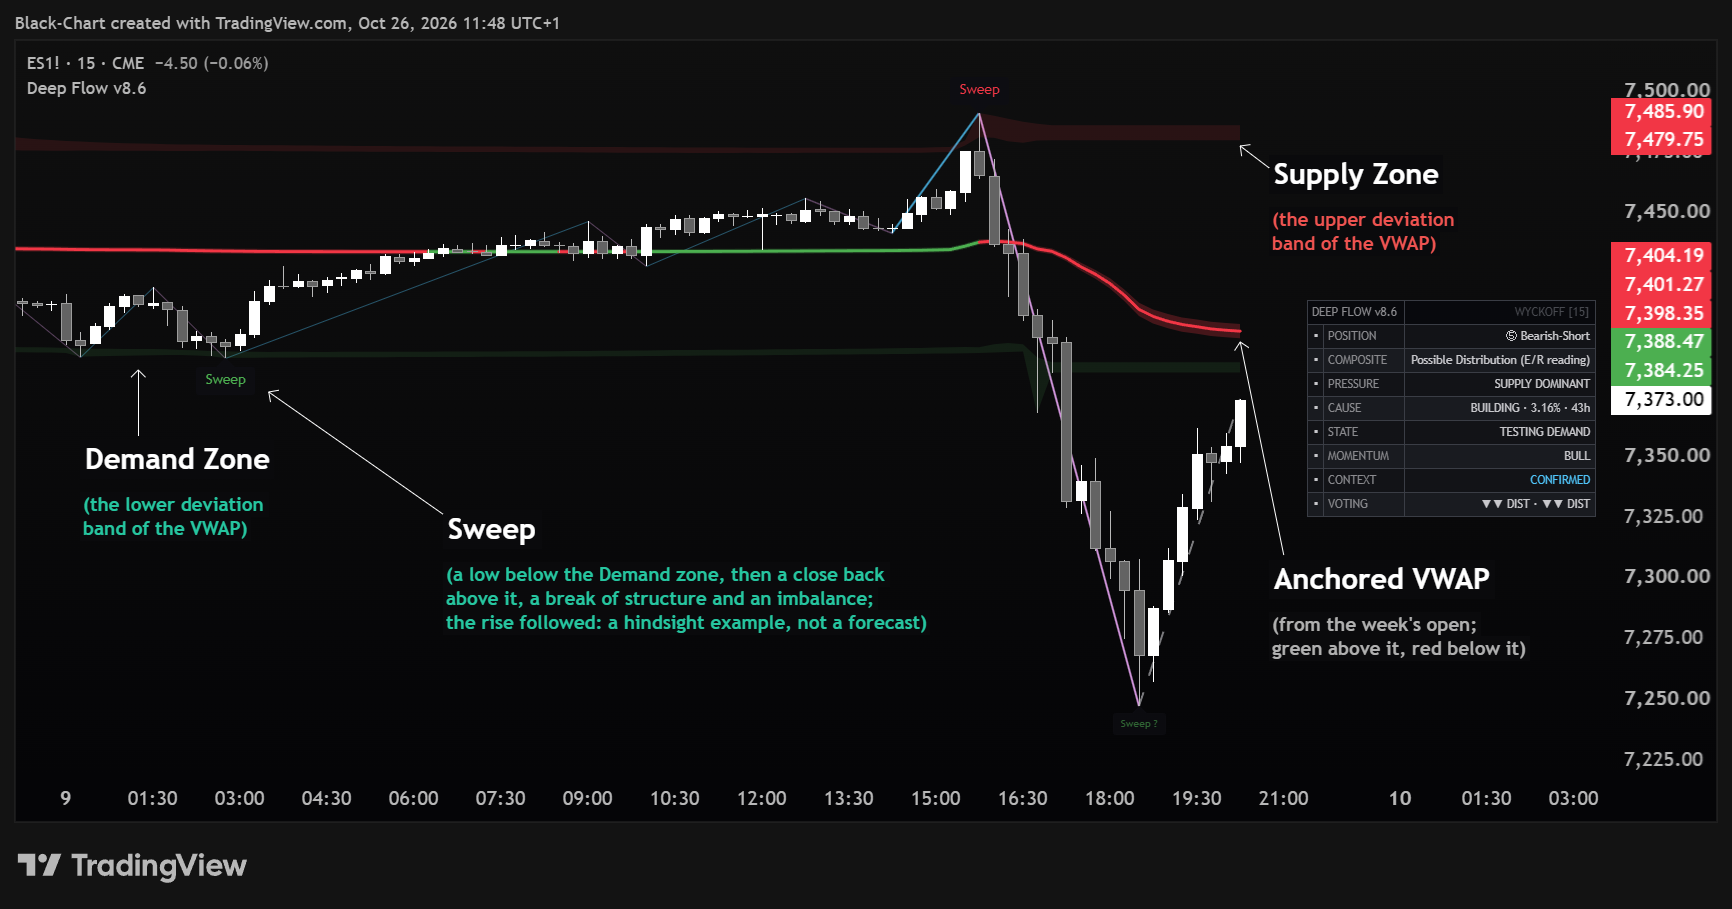
Deep Flow on an E-mini S&P 500 futures 15-minute chart: the anchored VWAP, the Supply and Demand zones and two Sweep markers, every element annotated.
Real flow direction
Market context
Volume-based clarity
Structural Decoder

Decode structure before execution

Structural Decoder maps liquidity, higher-timeframe levels, market structure and classic chart patterns confirmed by structure, so traders know where price sits before they act.

explore indicator
Structural Decoder on a Nasdaq futures 1-hour chart with liquidity levels, CHoCH and BOS, premium and discount, a double bottom confirmed by structure and the dashboard, every element annotated.
Read clean structure
Reduce chart noise
Define the market framework
Wave Engine

Measure each wave against the one before

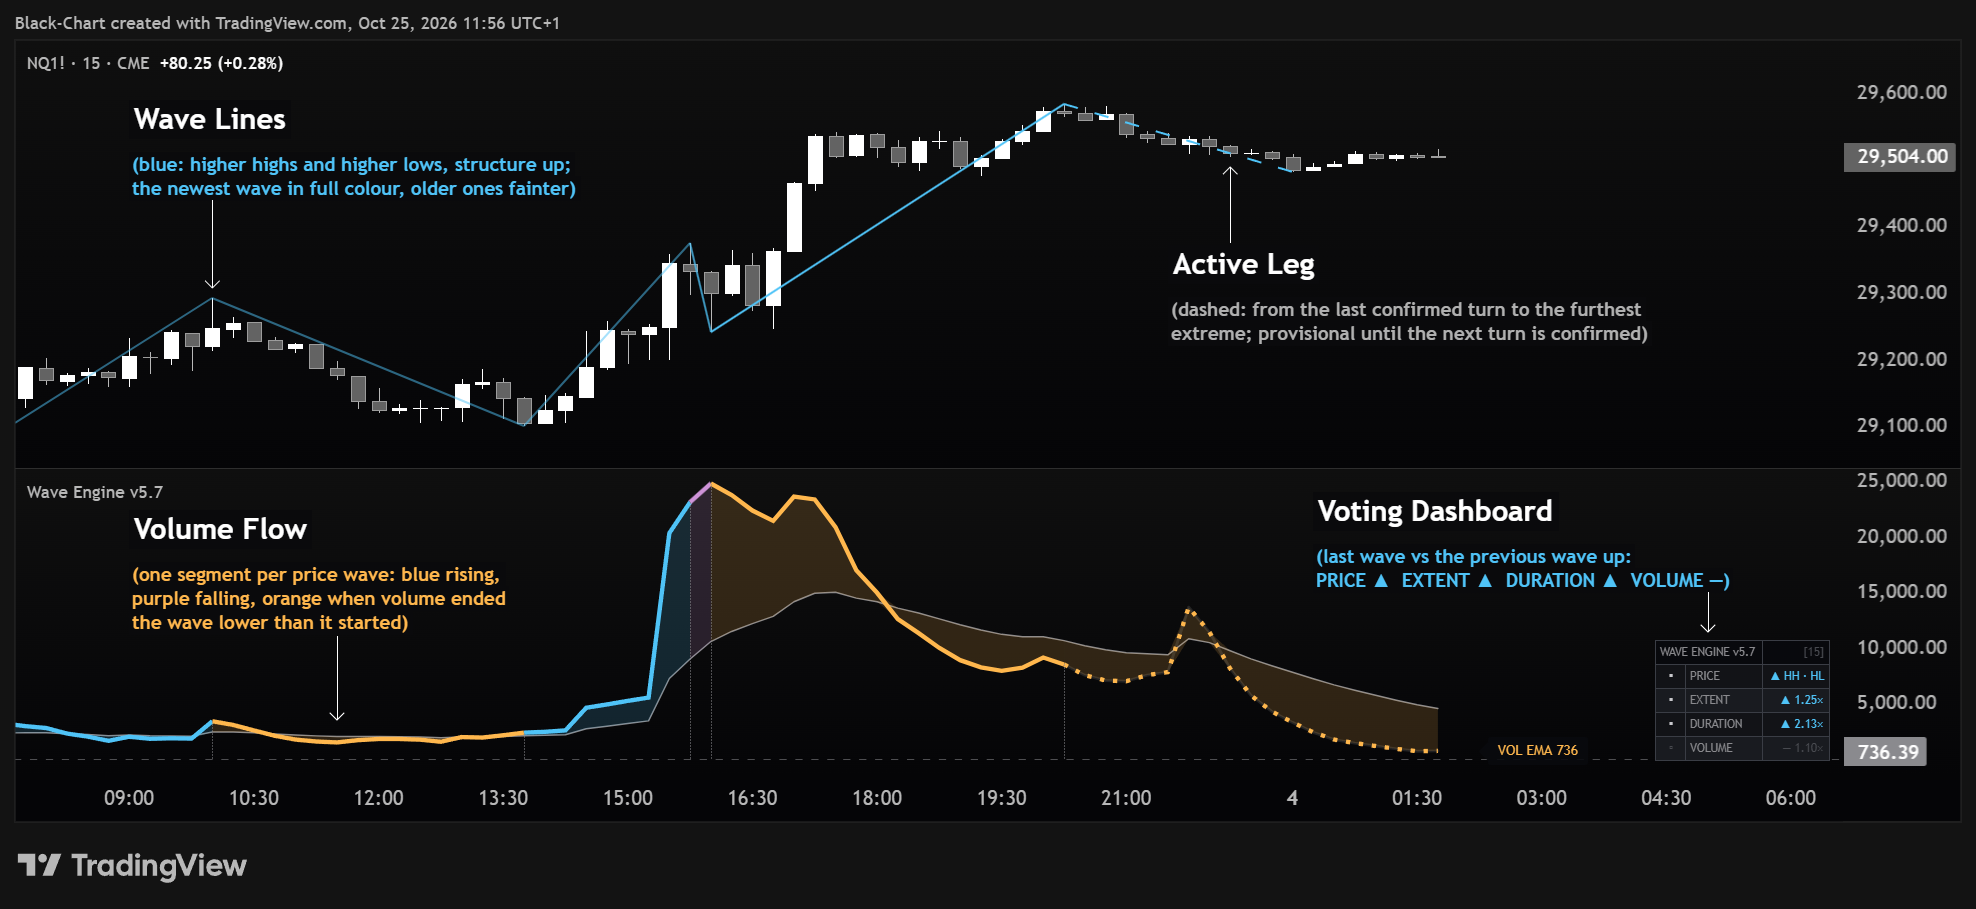
Measure each wave's distance, duration and volume, and compare it with the previous wave in the same direction, with Wave Engine.

explore indicator
Wave Engine on a Nasdaq futures 15-minute chart: wave lines, the active leg, the Volume Flow curve in the lower pane and the voting dashboard, every element annotated.
Compare wave with wave
Read volume behind movement
Measurements, not signals
Smart Money Radar

Locate sweeps, imbalances, and the zones still in play

Locate liquidity sweeps, imbalances, and the supply and demand zones still in play with Smart Money Radar.

explore indicator
Smart Money Radar in Clean mode on a Nasdaq one-hour chart: one supply zone with its score.
Read liquidity sweeps
Track imbalances
Map supply and demand zones
get started

Access the full BlackChart system

The complete framework to read context, map structure, compare the waves and read liquidity before execution.