Read macro context, volume behavior, supply and demand pressure, and Wyckoff state with Deep Flow, the context engine of BlackChart.
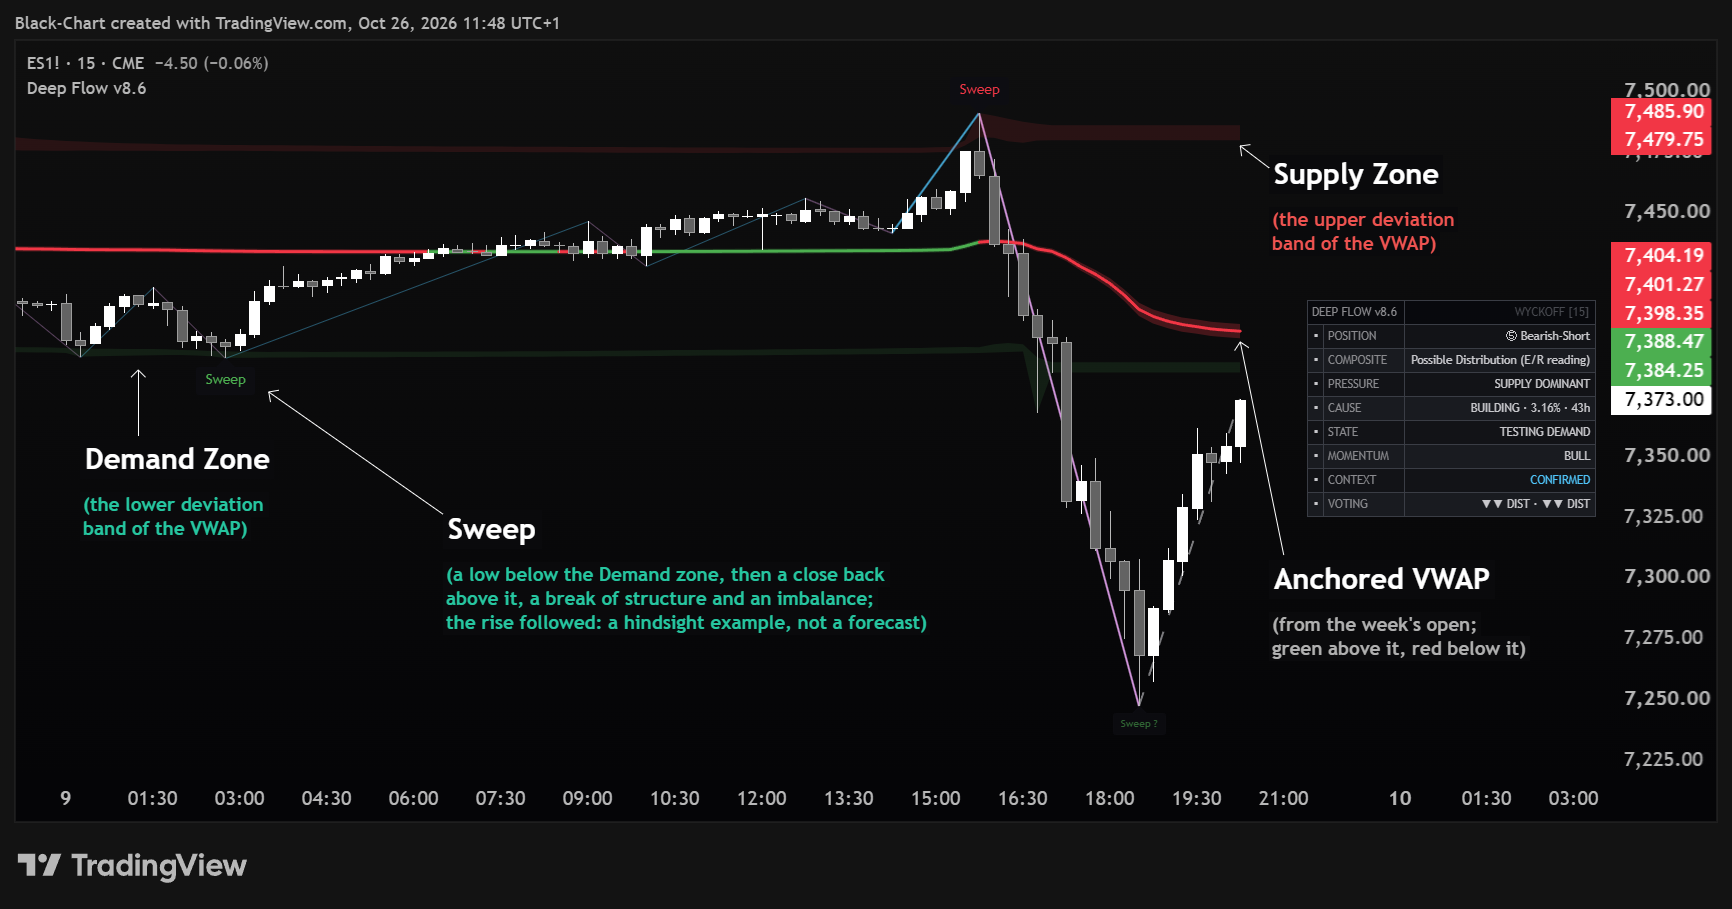
Deep Flow is the context engine of the BlackChart Suite. It helps traders understand the broader market condition before they start looking for entries, zones, or short-term confirmation. Its role is not to generate buy or sell signals. Its role is to show whether the current environment is readable, which side has stronger context, and how much conviction appears to be behind the move.
Many trading mistakes begin when traders react to price before reading the environment. A candle moves, a level breaks, or a common signal appears, but the broader context may still be unclear. Deep Flow helps bring that context forward by reading volume behavior, fair value references, supply and demand pressure, and Wyckoff-style market state.
The goal is to give traders a cleaner first layer of understanding. Before asking where to enter, Deep Flow helps answer a more important question: what phase is the market in, and who appears to be in control?
Deep Flow exists to reduce blind reaction. It helps traders avoid treating every price move as equal by giving them a broader read of market participation. When the market is showing accumulation, distribution, balance, or directional pressure, the trader can read the rest of the chart with more structure.
This makes Deep Flow the first step in the BlackChart workflow. It defines the readable side of the market, helps filter weak conditions, and gives the rest of the framework a stronger base.
Price alone can be misleading. A breakout can look strong but lack real participation. A pullback can look dangerous but remain healthy inside a stronger structure. A market can drift without conviction and still trigger common price-based tools.
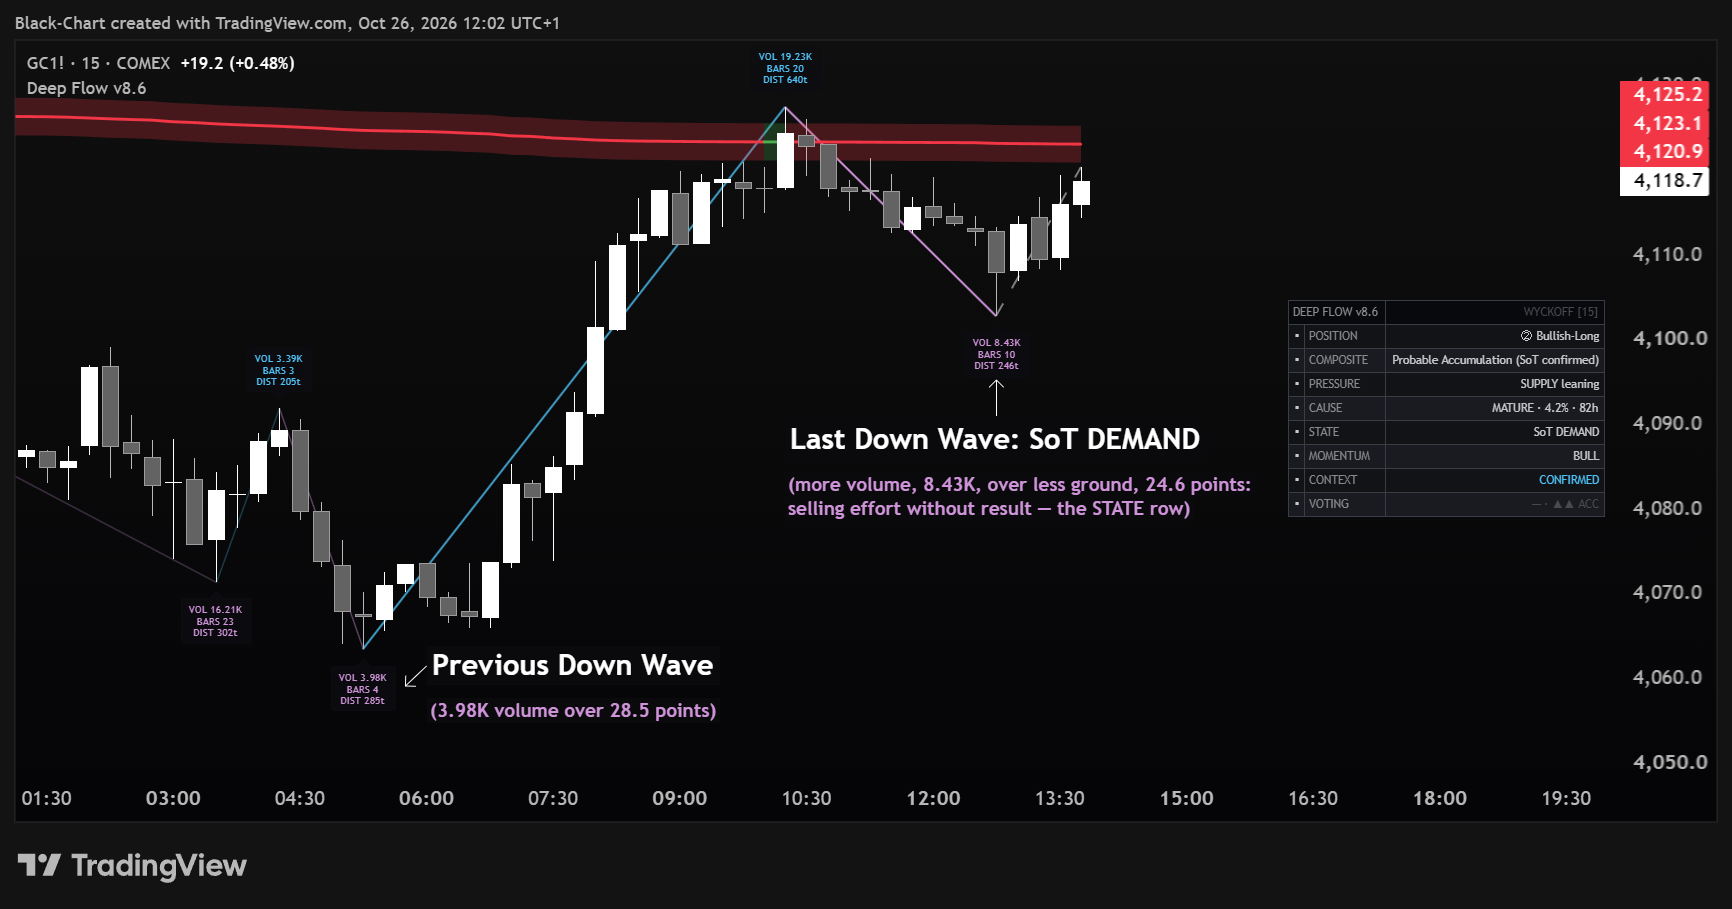
Deep Flow helps solve this by reading the market through context rather than isolated movement. It gives traders a way to judge whether price is supported by coherent volume behavior, whether supply or demand is stronger, and whether the current condition is clear enough to act on.
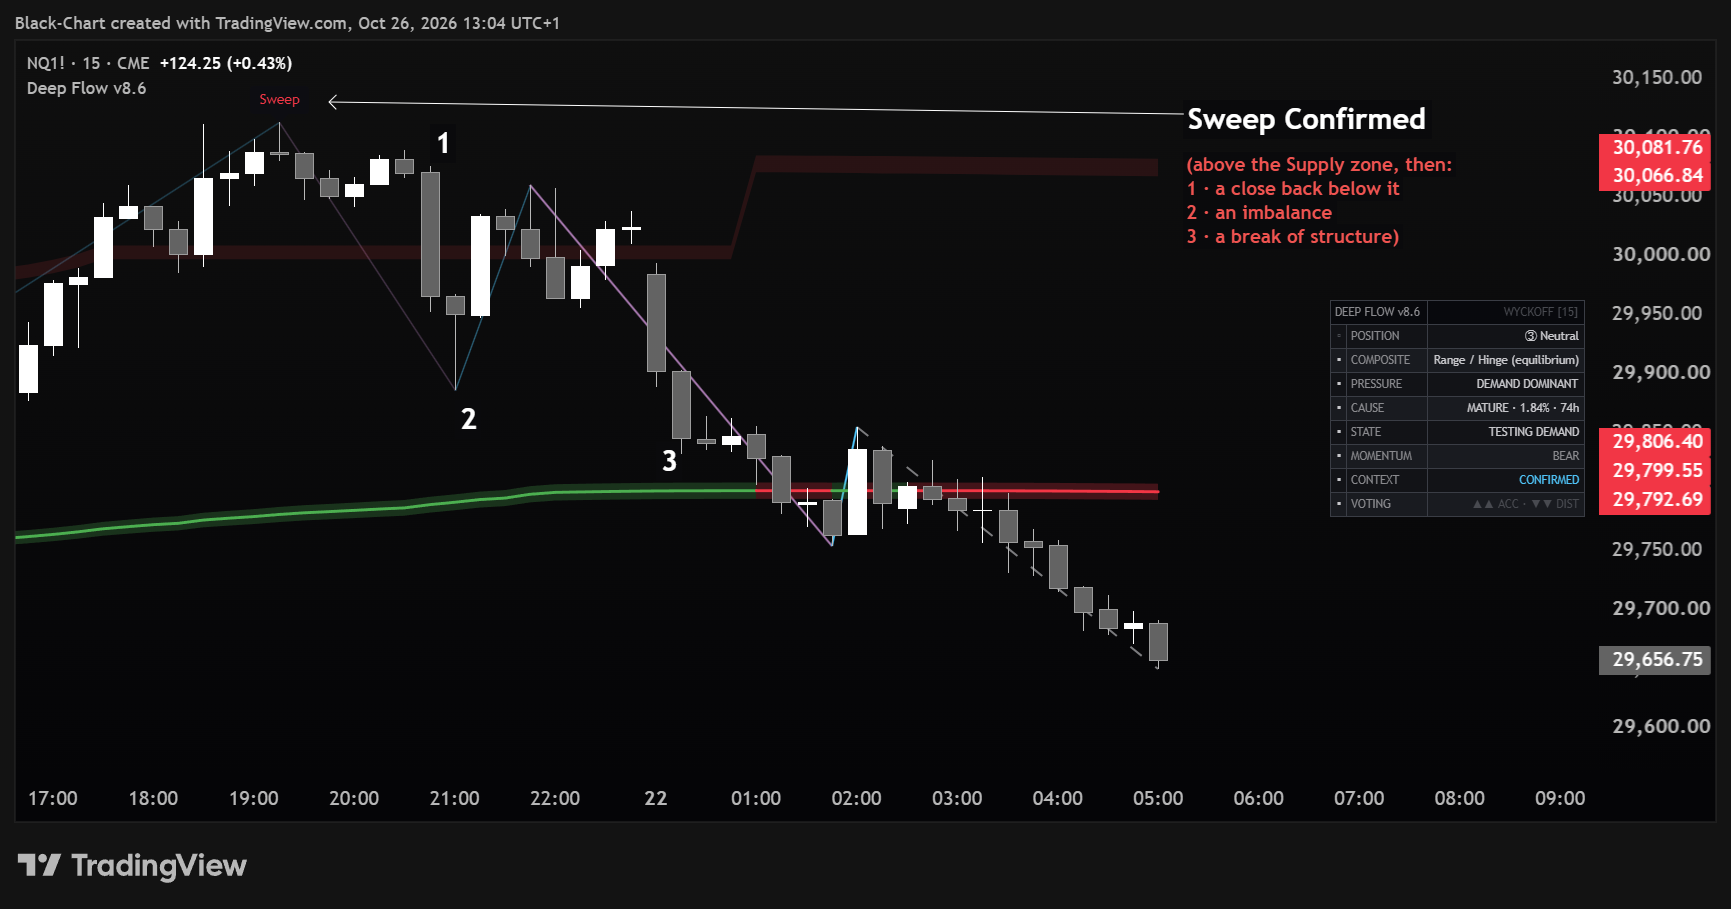
Sweep ? marks liquidity taken beyond a zone; it becomes a confirmed Sweep only after price closes back inside, breaks structure and leaves an imbalance. It marks an event, not an entry.
Deep Flow is the first pillar of the BlackChart decision chain: context. It gives the macro read before the trader moves into structure, flow, and trigger areas.
After Deep Flow defines the broader environment, Structural Decoder maps the market structure, Wave Engine reports the measured facts behind each wave, and Smart Money Radar shows liquidity sweeps and the zones still in play. Without context, the other layers are harder to read correctly.
This is a reading order. It describes how to interpret the panel; it does not tell the trader what to trade.
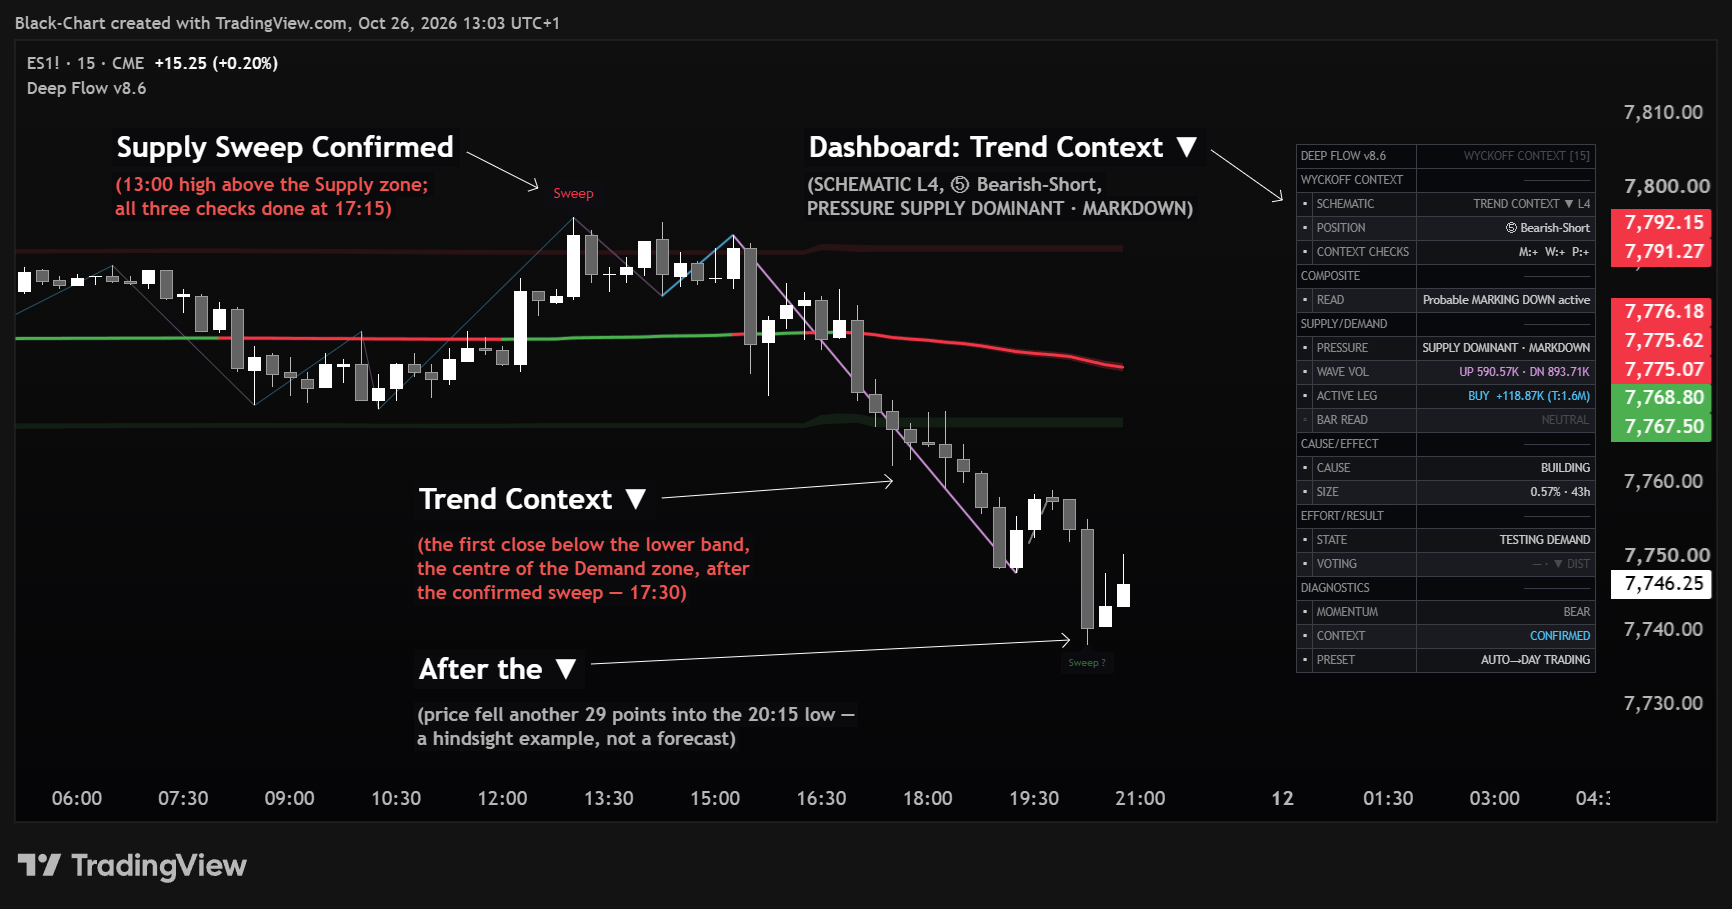
Deep Flow should not be treated as a scalping trigger or a buy and sell generator. It is a context read, not an entry system, and a Sweep marker is an event that has happened, not a signal.
Everything is measured from the anchor, so early in a period, or on a high timeframe where the range holds few bars, the read can be thin. In that case use a lower timeframe or a wider Reference Period.
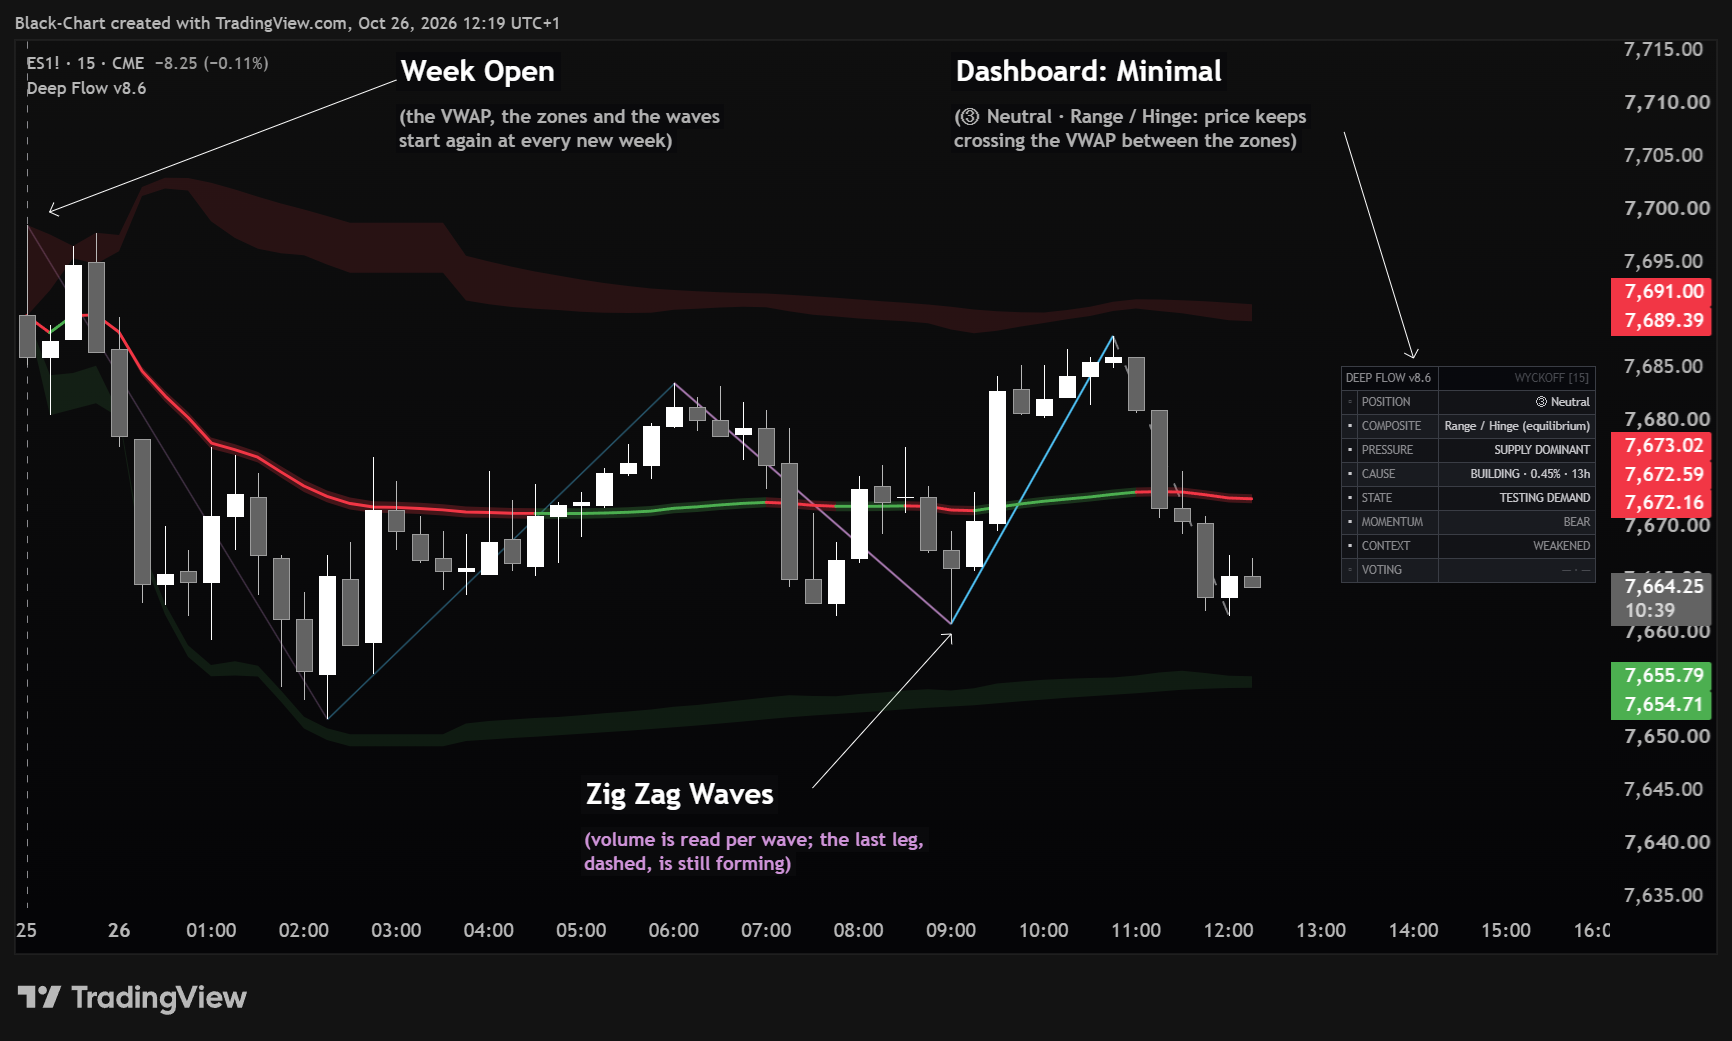
Deep Flow matters because every later decision depends on context. A structural shift, a wave, or a reaction zone does not mean the same thing in every market condition. By helping traders read the broader state of the market first, Deep Flow gives the BlackChart framework its foundation.
It is built for traders who want to stop reacting to lagging signals and start reading market behavior through volume, context, and Wyckoff logic before execution.
Access a professional toolset built on Wyckoff logic, volume, and liquidity. No automation. No simplification. Only structure.