Skip to content
Structural Decoder

Decode structure before execution

Structural Decoder maps liquidity, prior highs and lows, CHoCH and BOS, premium and discount, sessions, Range Projection and chart patterns confirmed by structure.

Structural Decoder on a Nasdaq futures 1-hour chart with liquidity levels, CHoCH and BOS, premium and discount, a double bottom confirmed by structure and the dashboard, every element annotated.
Read clean structure
Reduce chart noise
Define the market framework

The structure layer of BlackChart

Structural Decoder is the market structure and liquidity map of the BlackChart Suite. It helps traders understand which levels matter, what structure the market is following, which liquidity references remain relevant, where price sits inside the active range, and which classic chart patterns its swings are drawing.

Its role is to turn a busy chart into a more organized briefing. Instead of adding disconnected signals, Structural Decoder brings together the structural elements needed before execution: liquidity levels, higher-timeframe references, daily and midnight opens, market structure, equal highs and lows, premium and discount, session boxes and opening ranges, floating higher-timeframe candles, Range Projection and chart patterns.

The goal is to help traders define the field before acting. When the market structure is clear, execution decisions can be planned around documented structural context instead of isolated price movement.

Core purpose

Structural Decoder exists to map the operating environment. It gives structure to the chart so traders can see where liquidity rests, which higher-timeframe references matter, how structure is shifting, and where price sits within its current dealing range.

It does not replace market judgment. It provides a cleaner structure layer so the chart can be read with less noise and a clearer framework.

Structural Decoder on a Nasdaq futures 1-hour chart with liquidity levels, CHoCH and BOS, premium and discount, a double bottom confirmed by structure and the dashboard, every element annotated.

What problem it solves

Charts can become difficult to read when important structural references are scattered across different tools. Swing liquidity, previous day, week and month levels, opens, structural shifts, equal highs and lows, session ranges, higher-timeframe candles, range projections and chart patterns all provide context, but only when they are organized coherently — and a pattern scanner that calls a pattern complete as soon as price crosses a line says nothing about whether structure agreed.

Structural Decoder brings those references into one map. One Structure Sensitivity sets the swings behind the liquidity levels, the breaks of structure and the swings the patterns are drawn on, and a pattern is confirmed only by the same break of structure that labels CHoCH and BOS.
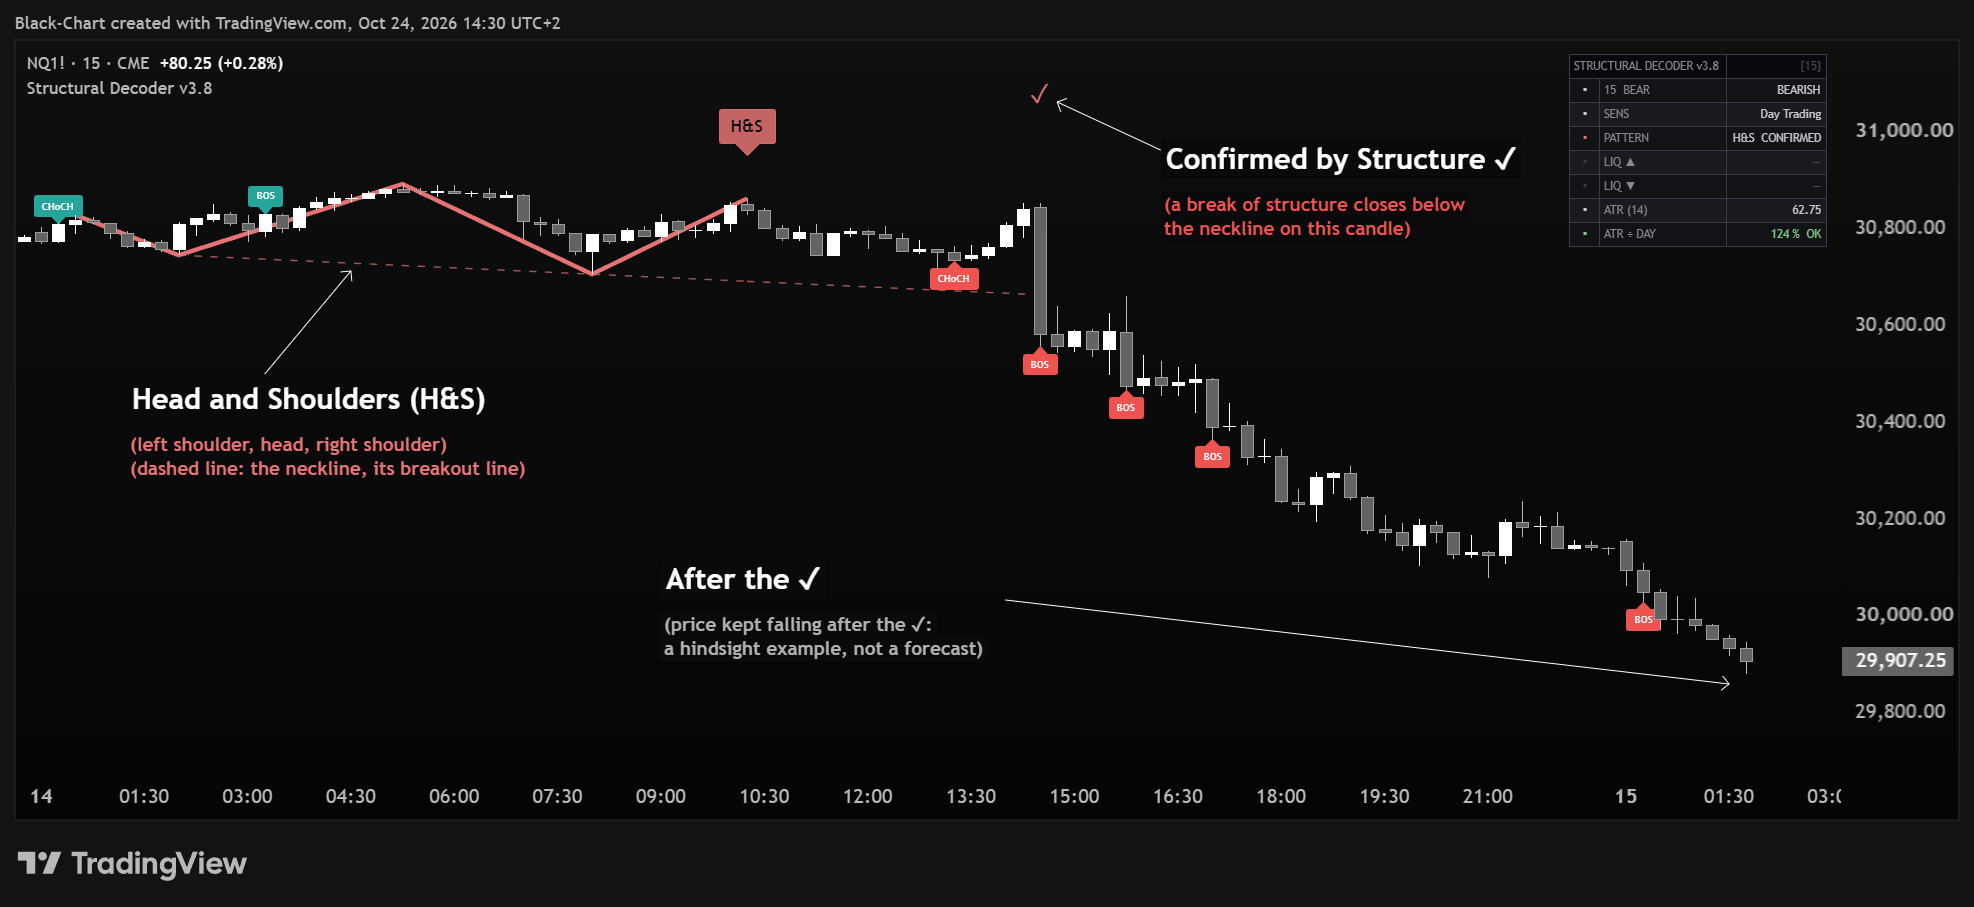
A head and shoulders confirmed by a break of structure below its neckline, on a Nasdaq futures 15-minute chart.
An inverse head and shoulders invalidated when price takes the head's low before any break above the neckline, on a Nasdaq futures 15-minute chart.

What it reads in the market

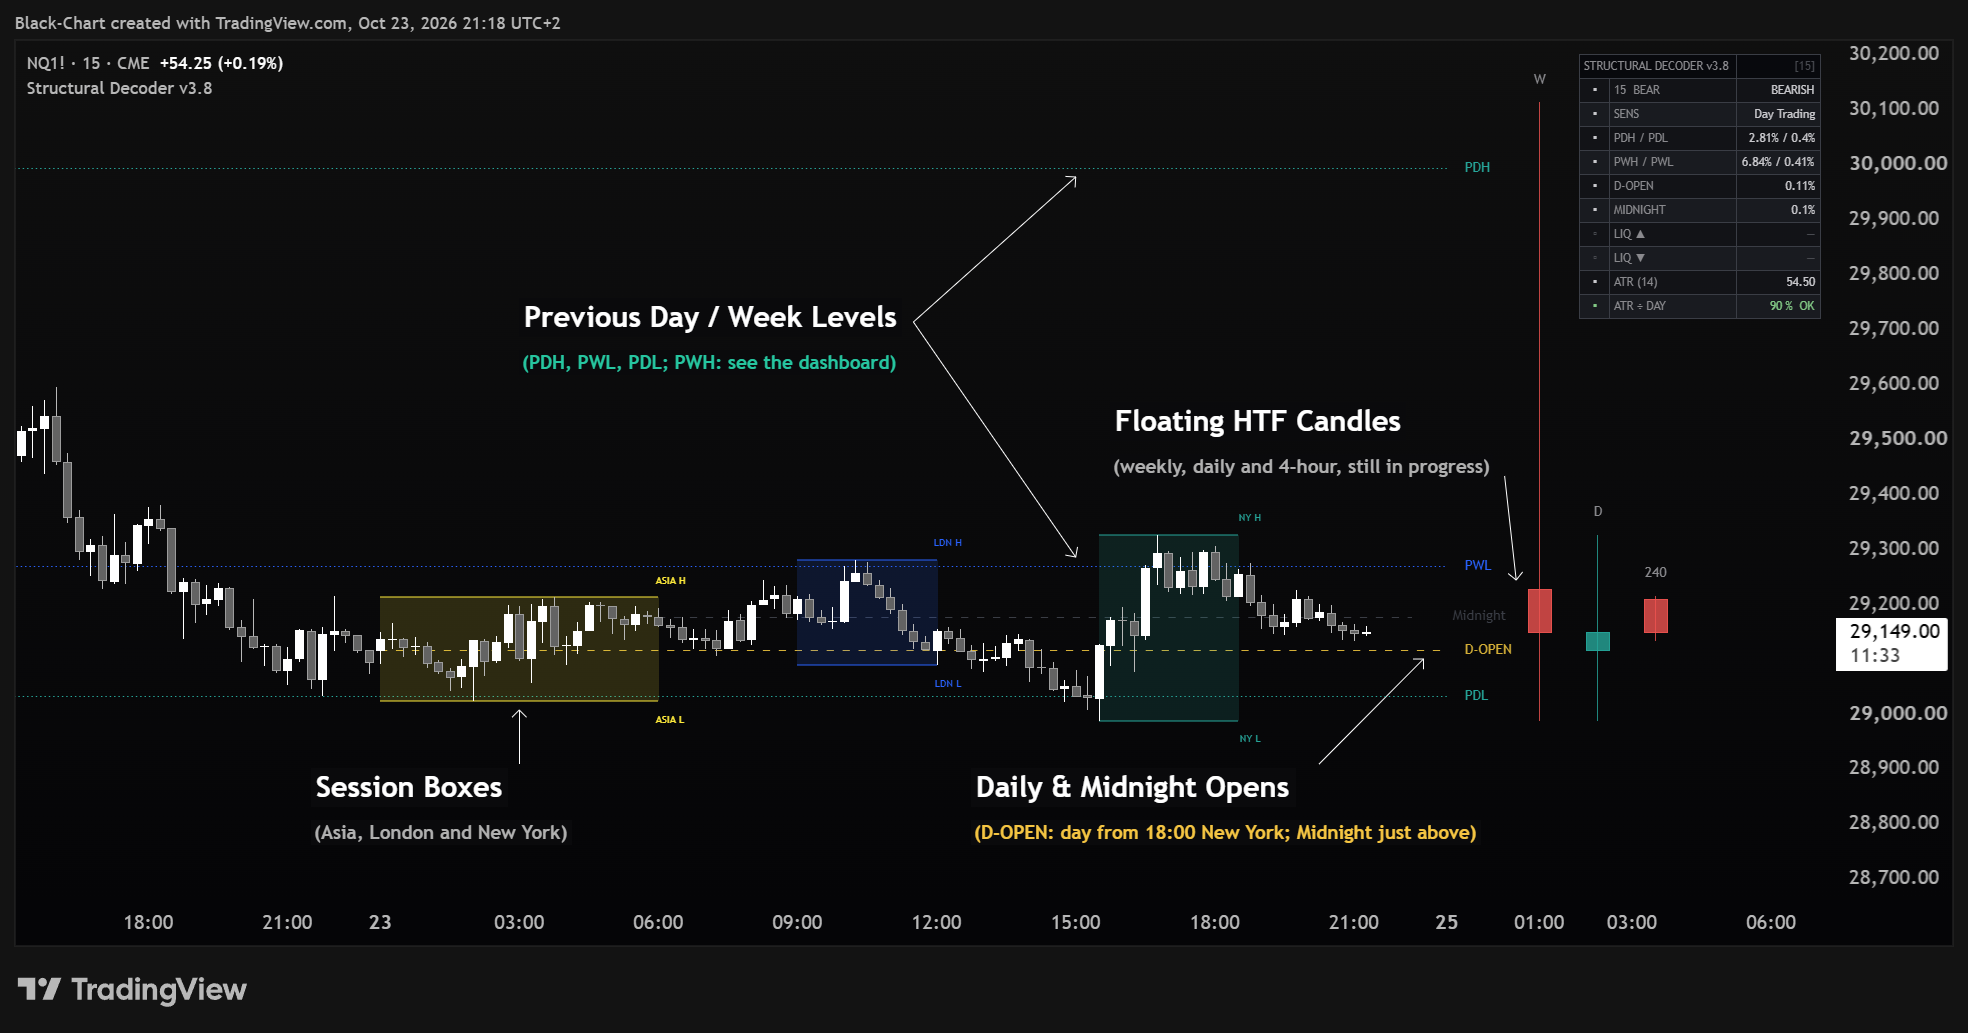
  • Liquidity levels on confirmed swing highs and lows
  • Previous day, week and month highs and lows
  • Daily and Midnight Opens
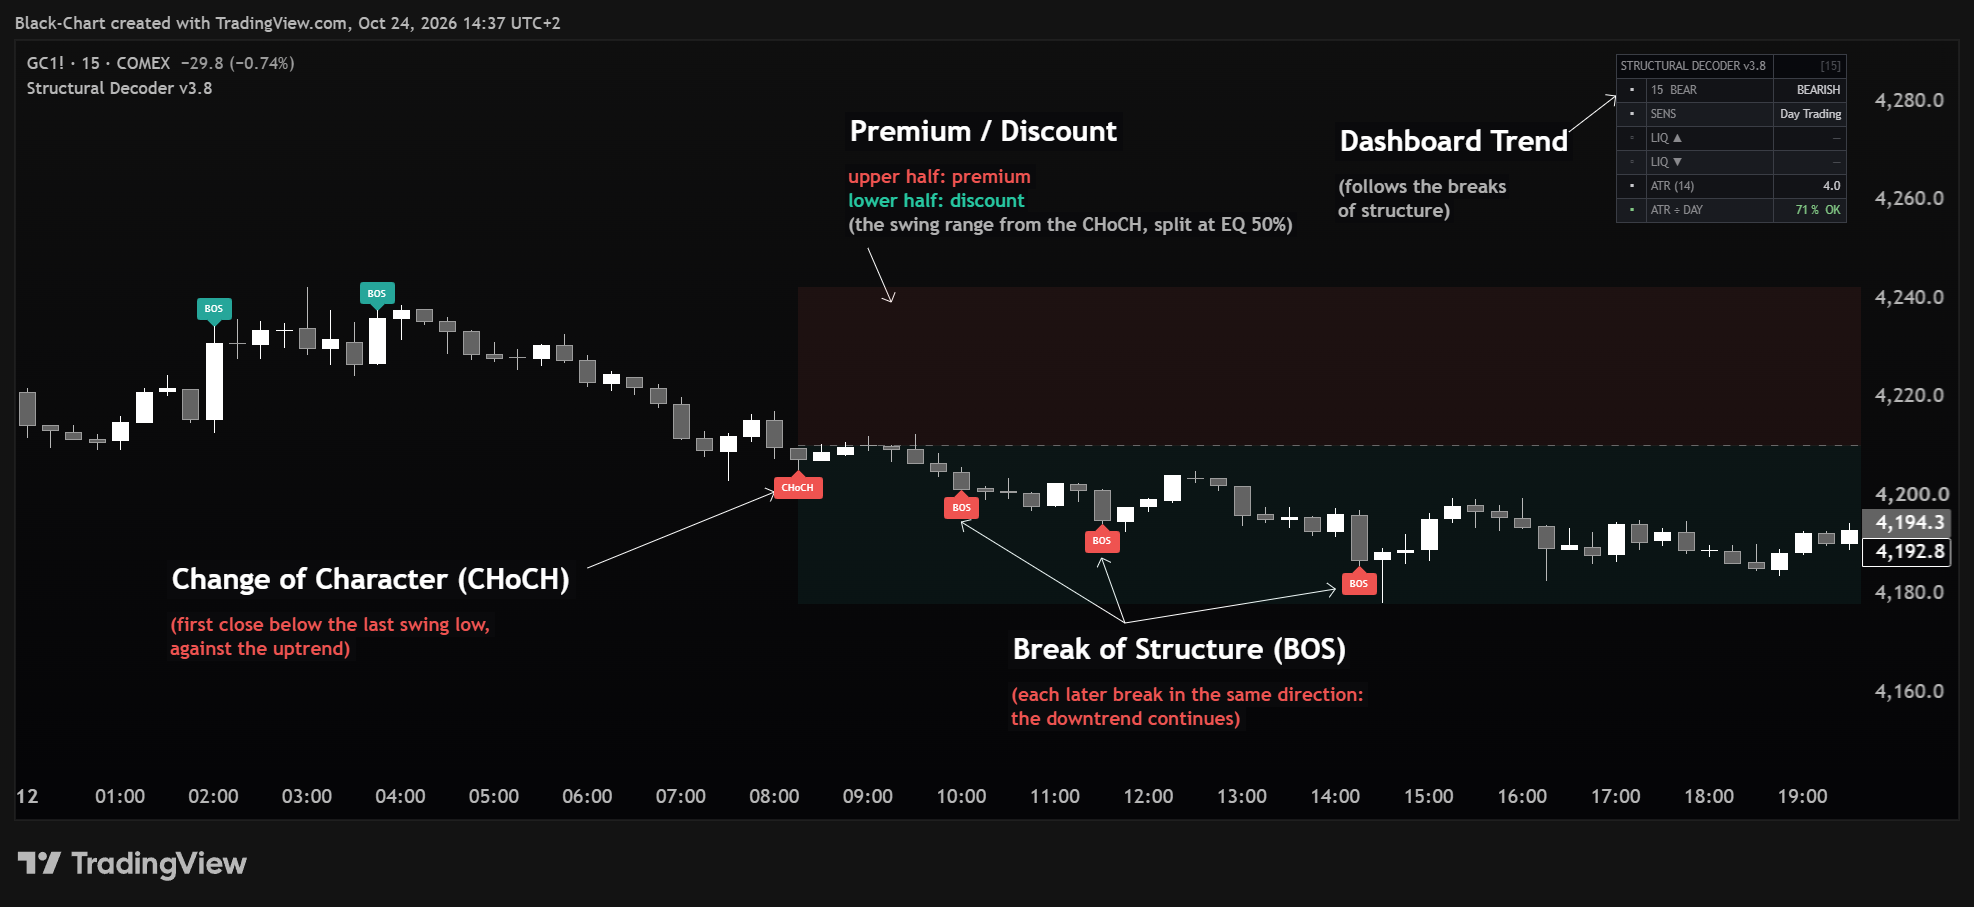
  • CHoCH and BOS: closes beyond the last swing with momentum, confirmed at the candle close
  • Equal highs and equal lows as clustered liquidity references
  • Premium, discount and 50% equilibrium inside the current structural range
  • Asia, London and New York sessions, plus European and US opening ranges
  • Weekly, Daily and H4 floating candles for higher-timeframe context
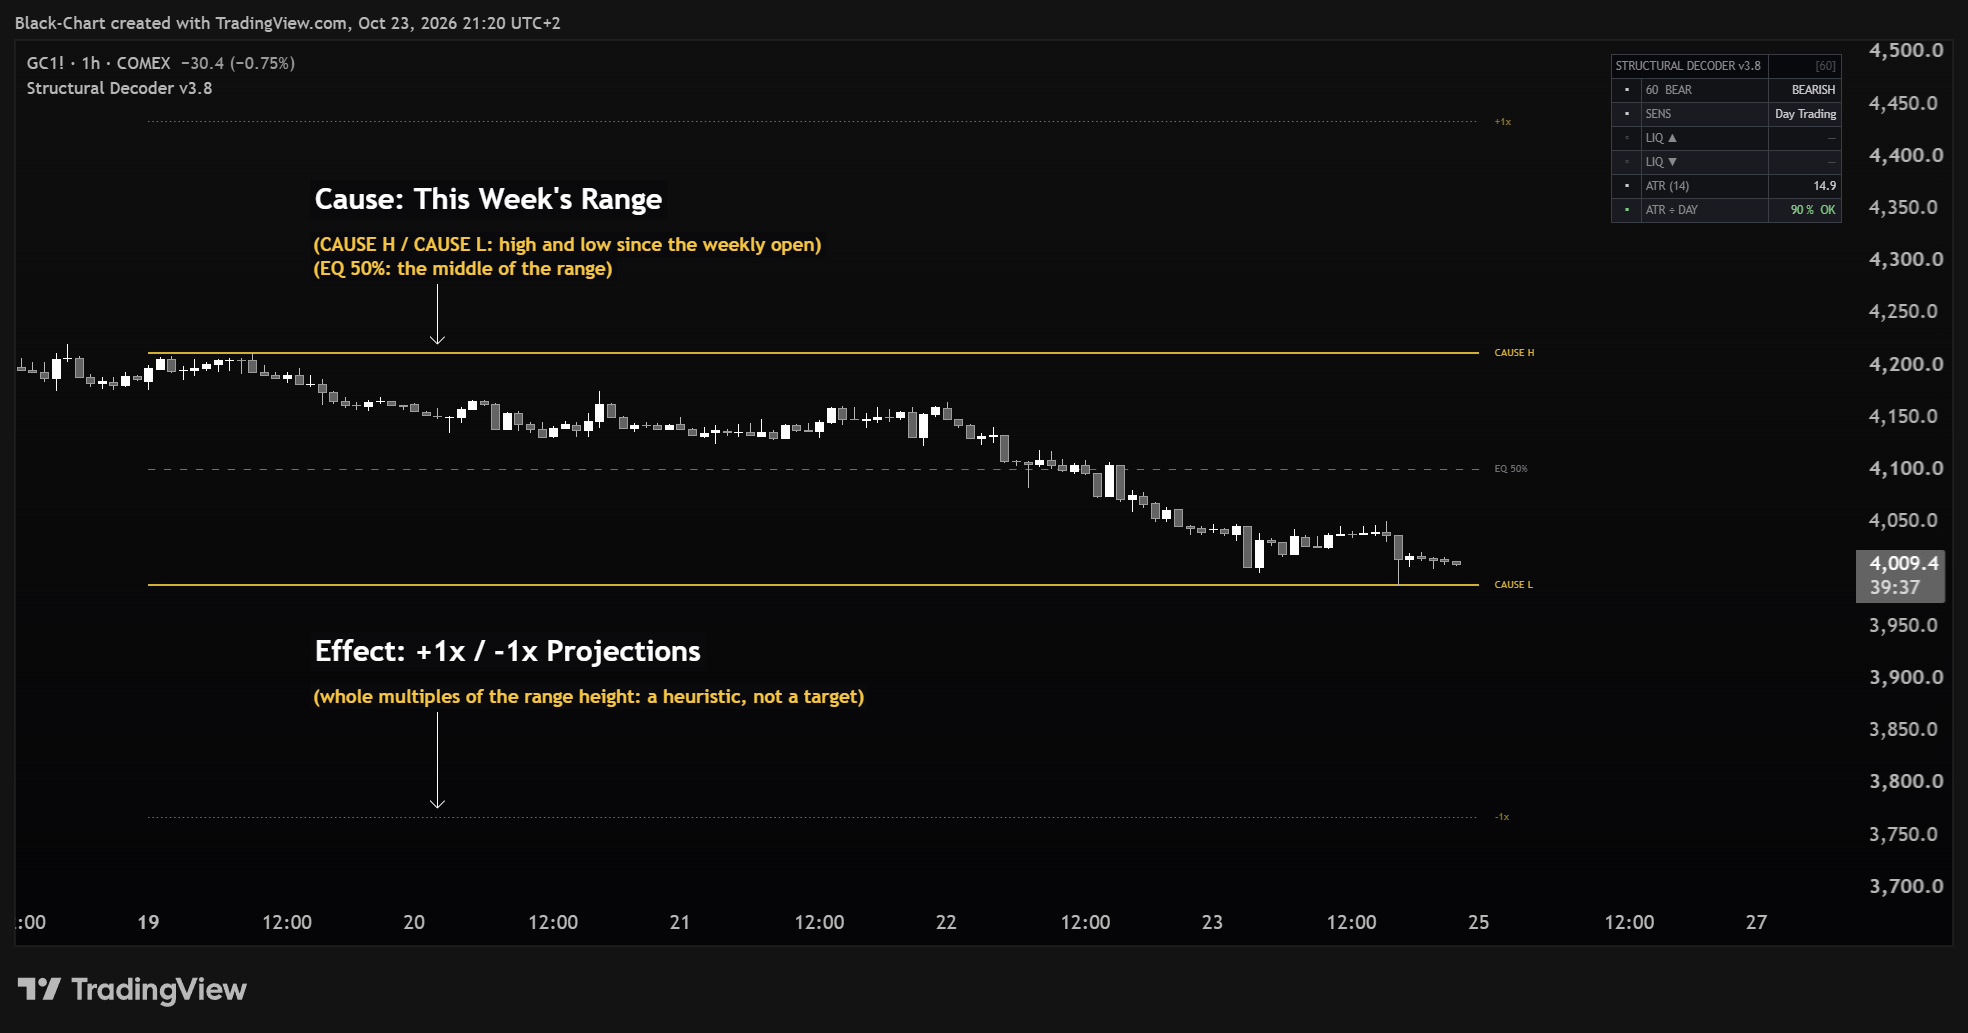
  • Range Projection: the current week's range, or a congestion you mark, and its projected multiples
  • Classic chart patterns on their own swings, marked ✓ when a break of structure confirms them or ✕ when price takes their invalidation level first
  • Current volatility in price and against its own daily norm
Previous day and week levels, daily and midnight opens, session boxes and floating weekly, daily and 4-hour candles on a Nasdaq futures 15-minute chart.

Key features and visible components

  • Liquidity Levels: swing highs and lows that show where resting liquidity sits; a line fades, or is removed, once a closed candle sweeps it.
  • Multi-timeframe Levels: previous Day, Week and Month highs and lows, including PDH, PDL, PWH, PWL, PMH and PML.
  • Daily and Midnight Opens: opening-price references used for intraday orientation.
  • Market Structure: CHoCH and BOS labels for momentum-filtered, close-confirmed shifts and continuations.
  • Equal Highs and Lows: EQH and EQL references for clustered liquidity.
  • Premium and Discount: the current structural range split at the 50% equilibrium.
  • Session Boxes and Opening Ranges: Asia, London and New York sessions, plus the European and US opening-range windows.
  • Floating MTF Candles: Weekly, Daily and H4 candles displayed beside price for higher-timeframe context.
  • Chart Patterns: twenty classic patterns — head and shoulders, double and triple tops and bottoms, cup and handle, triangles, rectangles, wedges, flags and pennants — each with its own switch and a colour per family, marked ✓ or ✕ by the market and kept from overlapping on the chart.
  • Structure Sensitivity: one preset — Auto, Scalping, Day Trading, Intraday, Swing, Position — that sets how reactive structure, liquidity and pattern swings are. Auto picks the level from the chart timeframe.
  • Range Projection: measures the current week, or a congestion you mark, and projects whole multiples of its height and its 50% equilibrium as a Cause and Effect framework.
  • Dashboard: structure trend, active sensitivity, distance to the levels you have switched on and to the nearest liquidity, the last pattern and its state, and two volatility rows (ATR and ATR against its daily norm).
A change of character followed by three breaks of structure, with the premium and discount range, on a gold futures 15-minute chart.

How it fits into the 4-pillar framework

Structural Decoder is the second pillar of the BlackChart decision chain: structure. After Deep Flow defines the broader context, Structural Decoder maps the structural field where a decision may take place.

Wave Engine then reports the measurable facts behind price waves, while Smart Money Radar handles liquidity sweeps, imbalances, and supply and demand zones within the execution layer.
How traders can use it

  • Start with the dashboard trend and, if you switch them on, the higher-timeframe candles for orientation.
  • Check the nearest higher-timeframe levels, opens and unswept liquidity references.
  • Switch on Premium / Discount to locate price relative to premium, discount and equilibrium.
  • Switch on the CHoCH and BOS labels to read confirmed structural change or continuation.
  • Switch on Chart Patterns to read the shape the swings are drawing, and let the ✓ or ✕ say whether structure agreed.
  • Use session boxes and opening ranges when intraday context matters.
  • Use Range Projection in Manual mode only from a meaningful congestion range rather than an impulse move.
Range Projection in Auto on a gold futures 1-hour chart: this week's range with its 50% equilibrium and the +1x and -1x projections.

When not to use it

Structural Decoder is a dense structural map, so showing every module at once can make the chart harder to read. Traders should keep only the layers that fit their workflow and timeframe.

Opening-range and session information is most useful on lower intraday timeframes, while Range Projection depends on a sensible anchor. Chart patterns describe the shape of the market: a ✓ says that structure agreed with the shape, not how far price will go. Structural Decoder is a context map, not a standalone entry signal.

Why it matters

Structural Decoder matters because structure gives price movement context. It organizes the references that define where the market is operating before execution is considered.

Inside BlackChart, Structural Decoder provides the second layer of the decision chain: a clear map between Deep Flow context and the measurable wave information provided by Wave Engine.

get started

Align your execution with market reality

Access a professional toolset built on Wyckoff logic, volume, and liquidity. No automation. No simplification. Only structure.